Product Design
Dashboard UX Audit: Tables, Filters, States and Actions
A task-first dashboard UX audit for B2B product leads, with an annotated fictional dashboard, table and filter checks, a state review and a findings log ranked by task impact.

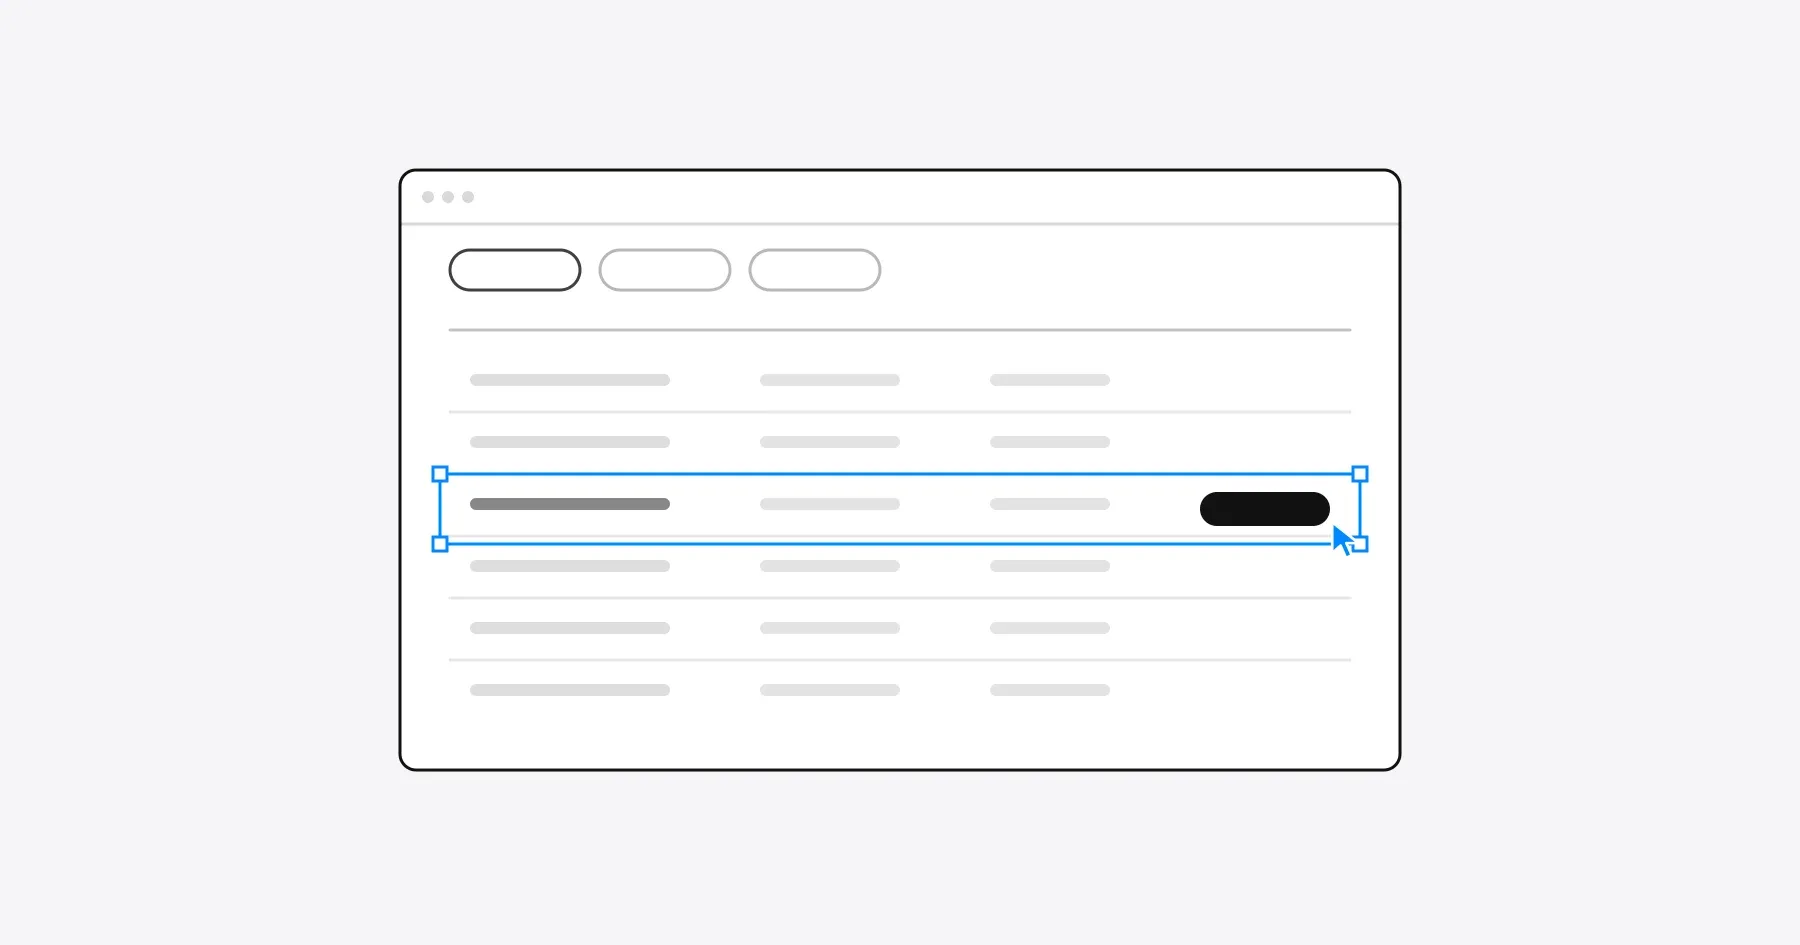
A dashboard UX audit checks whether people can complete the task the dashboard exists for: find the right records, understand them and act on them. Review that path through tables, filters, actions and data states first, and judge charts last, because most dashboard friction sits in finding and acting on records rather than in the visualizations.
This guide is for B2B product leads reviewing an information-dense screen in a SaaS product, such as an operations dashboard, an admin view or a work queue. It adds dashboard-specific checks to the general SaaS UX audit checklist, which covers how to choose journeys and record evidence. The examples continue the fictional contract renewal tool from the SaaS onboarding guide, now at the point where a team uses it every week.
Start with the user’s task, not the chart count
Start a dashboard audit by writing down the one task the screen must support for each role, then judge every element by whether it helps that task. A dashboard with six charts and a table can still fail if the person who opens it every morning cannot find the five records that need attention today.
| Role | Task on the dashboard | What they need to see first | Action that ends the task |
|---|---|---|---|
| Procurement lead | Give every contract renewing in the next 30 days an owner | Unassigned renewals, soonest first | Assign an owner to several contracts at once |
| Finance approver | Approve renewals above the spend limit | Renewals waiting for approval, by value | Approve, or return with a comment |
| Team member | Prepare the renewals they own | Their own contracts and due dates | Upload new terms and mark the contract ready |
| IT reviewer | Check renewals of connected tools | Contracts linked to an integration | Flag a contract for security review |
Write each task as one sentence with a condition and an action: “Find contracts renewing in the next 30 days that have no owner, and assign them.” That sentence becomes the audit script. Walk it on the real dashboard with each role’s account and note every place where the person has to search, remember, repeat or guess.
Then review each chart against the same tasks. Ask which decision the chart changes and which role makes that decision on this screen. A chart that no role acts on during the task belongs in a report, where it does not push the working table down the page.
Read the annotated dashboard
The dashboard below is a fictional example built for this guide. Each number marks a finding in the log at the end of the article.
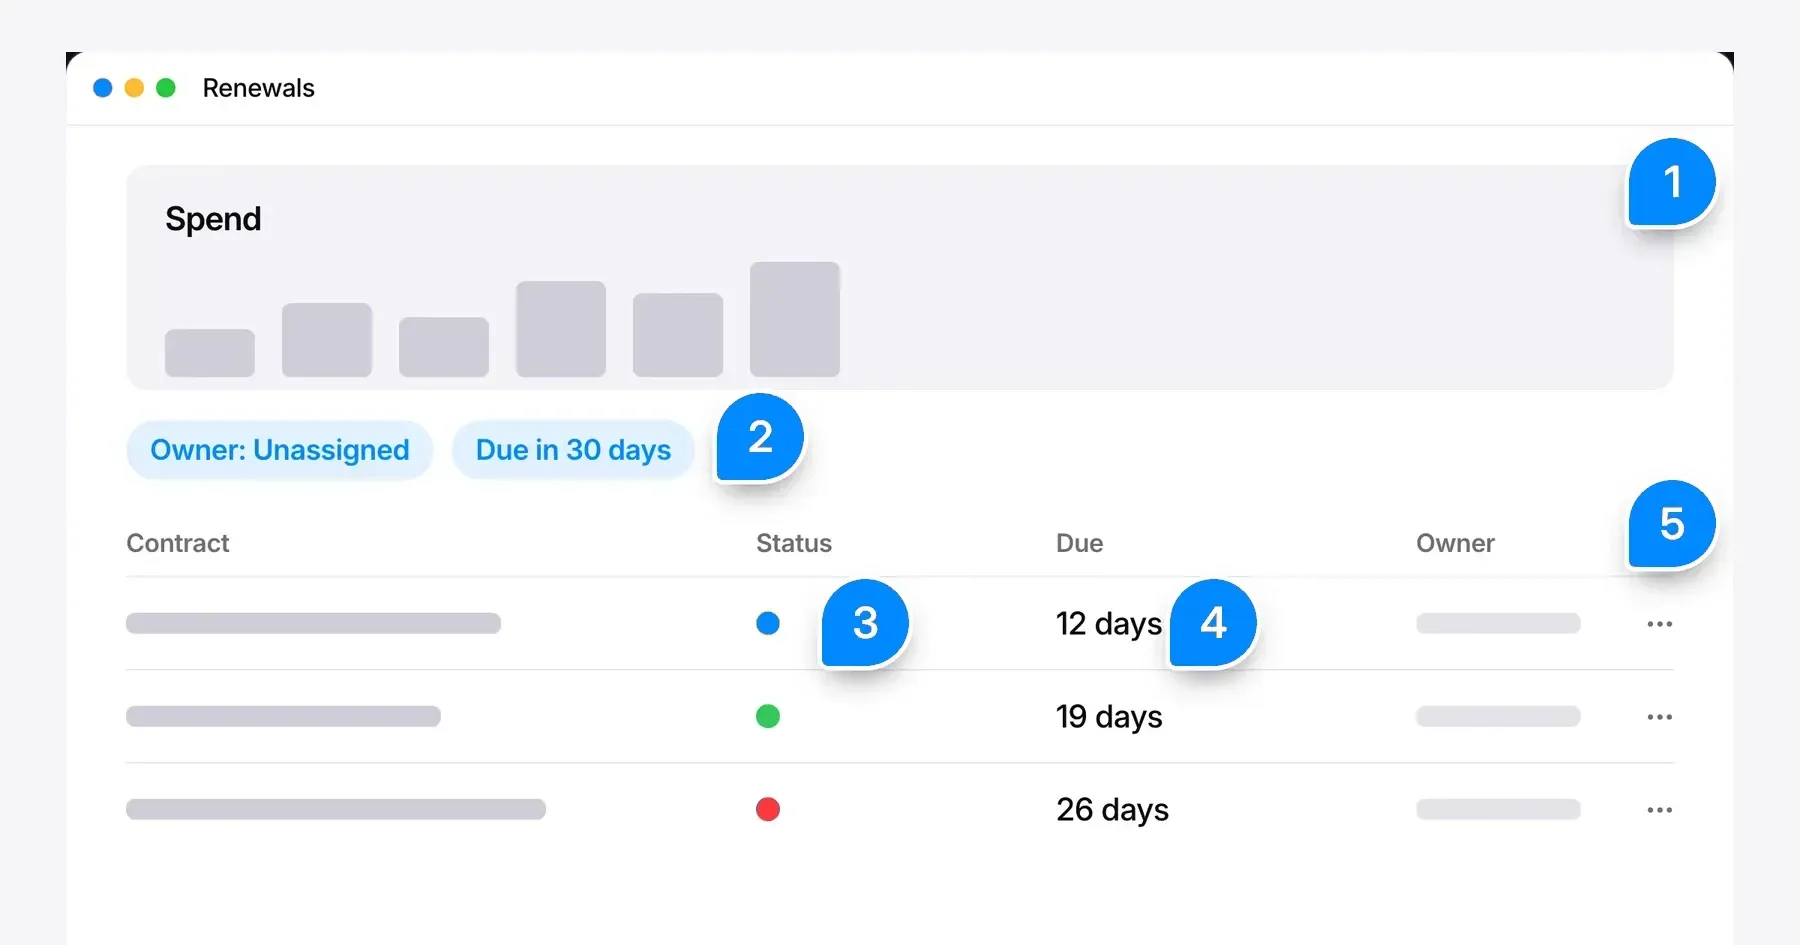
The procurement lead’s task runs through every note. The spend chart (1) takes the top of the screen, the filters (2) narrow the list but reset when a contract is opened, the status dots (3) rely on color alone, the due column (4) hides the actual date and the row menu (5) offers one contract at a time.
Review tables, filters and action hierarchy
A dashboard table works when people can find records that match a condition, compare them, open one without losing their place and act on several at once. Those are the four table tasks Nielsen Norman Group describes in its guide to data table design (Page Laubheimer, 2022), and each one has checks you can run on your own screen.
Table checks
| Check | What to look for | Common failure |
|---|---|---|
| The first column identifies the record | A name people recognize, such as the vendor and contract | Rows begin with an internal ID nobody uses |
| Column order follows the task | Due date, owner and status next to the name for renewal work | The column that decides the task is off-screen on a laptop |
| Headers stay visible | Frozen header row and first column when the table scrolls | People lose track of which column a value belongs to |
| Sorting is visible | The sorted column and direction are marked in the header | A sorted list with no sign of how it is sorted |
| Detail opens beside the list | A side panel keeps the table in view | A modal hides the rows people were comparing |
| Several rows can be changed at once | Row checkboxes, select all and an action bar that shows the count | The same action repeated row by row |
| Values carry their units and dates | Currency, units and an absolute date next to a relative one | “12 days” with no date, so it cannot be matched to the contract |
Filter checks
| Check | What to look for | Common failure |
|---|---|---|
| Active filters are visible | Filter chips above the table, each removable, with a clear all option | Filters hidden inside a closed panel |
| The result count updates | A count such as “12 renewals” that changes with every filter | A count that reflects the unfiltered list |
| Filters persist | The same filtered view after opening and closing a record | Returning to the dashboard resets every filter |
| Repeated tasks have saved views | “Unassigned, due in 30 days” available in one click | People rebuild the same filter every morning |
| Filter options come from the data | An owner list of current users, a status list of real statuses | Free text fields that return nothing for a typo |
Nielsen Norman Group’s data table guide recommends a clear indicator when filters are active, because a filtered table looks complete to anyone who did not set the filter. Put the filter state in the URL as well, so a shared link opens the same view for a colleague.
Action hierarchy
Give each dashboard view one primary action that matches its main task, and keep the rest secondary. On the renewals view, assigning an owner is primary. Exporting, archiving and editing contract details belong in a row menu or on the detail panel.
- Primary action. Visible without opening a menu, labeled with the verb and object, such as “Assign owner”.
- Bulk actions. Shown when rows are selected, with the number of selected rows in the label.
- Destructive actions. Kept apart from frequent actions and confirmed with the record name in the message.
- Unavailable actions. Disabled with a reason, such as “Only admins can archive contracts”, rather than silently hidden from one role.
Status needs more than color. WCAG 2.2 success criterion 1.4.1, Use of Color, requires that color is not the only visual means of conveying information, so pair every status color with a text label or a distinct icon.
Check loading, empty, error and permission states
Review every state a dashboard can show, not only the full one, because people meet loading, empty, error and permission states every day and those states decide whether they trust the numbers. A dashboard that shows zero while it is still loading teaches people to doubt every zero.
| State | What to check | A good pattern |
|---|---|---|
| First load | The layout is reserved and nothing jumps when data arrives | Placeholder rows under the real column headers |
| Slow query | Feedback matches the length of the wait | A busy indicator after one second, progress and a cancel option after ten |
| Empty because the account is new | The screen explains its purpose and offers the first action | “Add your first contract”, with an upload and a sample option |
| Empty because of filters | The message names the filters that caused it | “No renewals match Owner: Unassigned” with a clear filters action |
| One widget fails | The error stays inside that widget and the rest of the dashboard works | An error message in the card, a retry button and the last successful update time |
| Stale data | People can see when the numbers were last refreshed | “Updated at 09:40” beside the totals |
| Missing permission | The screen says what is hidden and who can grant access | A locked column with a request access action |
| Read-only role | Actions the role cannot take are explained, not broken | Disabled actions with a reason on hover and focus |
Jakob Nielsen’s three response time limits set the thresholds for slow queries. A response within 0.1 second feels instant, a delay up to 1 second keeps the person’s flow of thought, and 10 seconds is the limit for keeping attention on the task. Nielsen’s 2014 update adds that any operation slower than 10 seconds needs a percent-done indicator and a clear way to interrupt it.
Result counts and loading messages also need to reach screen reader users. WCAG 2.2 success criterion 4.1.3, Status Messages, at Level AA, gives “18 results returned” and “Searching…” as examples of messages that assistive technology must announce without moving focus. Apply the same rule to the count that updates after each filter change.
Test each state on purpose. Prepare a new account, an account with a large number of records, a read-only role and a role without access to spend data, then repeat the main task with the network throttled in the browser’s developer tools.
Prioritize findings by task impact
Rank dashboard findings by how much each one slows or blocks the main task, then by how many roles meet it and how often. A filter that resets after every opened record costs the procurement lead time on every renewal, while a misaligned chart label costs nobody a decision.
Use the same severity definitions as your wider UX audit prioritization, so dashboard findings sit in one backlog with the rest of the product. Nielsen Norman Group’s guidance on rating the severity of usability problems weighs how often a problem occurs, its impact when it does and whether it persists after people learn the screen.
This is the findings log for the fictional dashboard above. The note numbers match the illustration.
| Note | Finding | Effect on the task | Who meets it | Priority | Next step |
|---|---|---|---|---|---|
| 2 | Filters reset after a contract is opened | The lead rebuilds the filter for every renewal | Procurement lead, daily | High | Keep filters in the URL and restore them on return |
| 3 | Status is shown only as a colored dot | People who cannot tell the colors apart cannot separate due from renewed contracts | Every role | High | Add a text label to each status |
| 5 | Contracts can only be changed one at a time | Assigning owners takes one action per row | Procurement lead, weekly | Medium | Add row selection and a bulk Assign owner action |
| 4 | The due column shows only days remaining | Approvers cannot match the date to the contract terms | Finance approver, weekly | Medium | Show the date with the days remaining |
| 1 | A spend chart sits above the table | The table starts lower on the screen, but no task depends on the chart | Every role, low cost | Low | Move the chart to the spend report |
Read the log for patterns before you plan the work. Two or three isolated findings are fixes for the next sprint. When most high findings trace back to one cause, such as a table designed for a different task, compare targeted UX fixes with a product redesign before you schedule anything.
Frequently asked questions
What should a dashboard UX audit include?
A dashboard UX audit should include the main task for each role, a walkthrough of that task, checks of tables, filters and actions, a review of loading, empty, error and permission states, and a findings log ranked by task impact.
How many charts should a SaaS dashboard have?
A SaaS dashboard should have as many charts as there are decisions people make on that screen. A chart that no role acts on during its main task belongs in a separate report.
Should a table row open in a modal or a side panel?
A side panel usually works better for a dashboard table, because the list stays visible while people read or edit one record. Nielsen Norman Group’s data table guide notes that modals hide the neighboring rows people want to compare.
How fast should a dashboard load?
A dashboard should respond within 1 second to keep people’s flow of thought, based on Jakob Nielsen’s response time limits. Anything slower than 10 seconds needs a progress indicator and a way to cancel.
How do I prioritize dashboard UX problems?
Prioritize dashboard UX problems by their effect on the main task first, then by how many roles meet them and how often. Fix what blocks or repeats work on every visit before visual polish.
Discuss your dashboard workflow
Bring the dashboard your team opens every day and the task it is meant to finish. Explore how Gestures approaches dashboard and platform design, including the data tables, roles and permissions covered in B2B SaaS product design, and we can walk through that task with you.
Working through a decision like this?
Bring your current product or website and we can discuss what needs attention.
Keep reading